What do I do as a UX Writer/Content Designer?
Research & Strategize
I conduct user research to understand the target users' needs and pain points. I then align the content strategy with these insights & stakeholder needs to find a happy medium & provide the best possible user experience.
Ideate & Collaborate
Working closely with design and development teams, I write clear & concise microcopy that guides users seamlessly through digital interfaces. I participate in sprints, help define user flows, and work to elevate interactive design.
Iterate & Optimize
After testing content, collecting feedback from stakeholders and users, and analyzing data on user interactions, I iterate and optimize content to improve comprehension and engagement.
Align & Expand
I help update style guides and design systems to maintain cohesiveness. I also research and offer up new ideas to team members and other stakeholders on how we can improve and expand our product.


Here's just a few samples of my work:
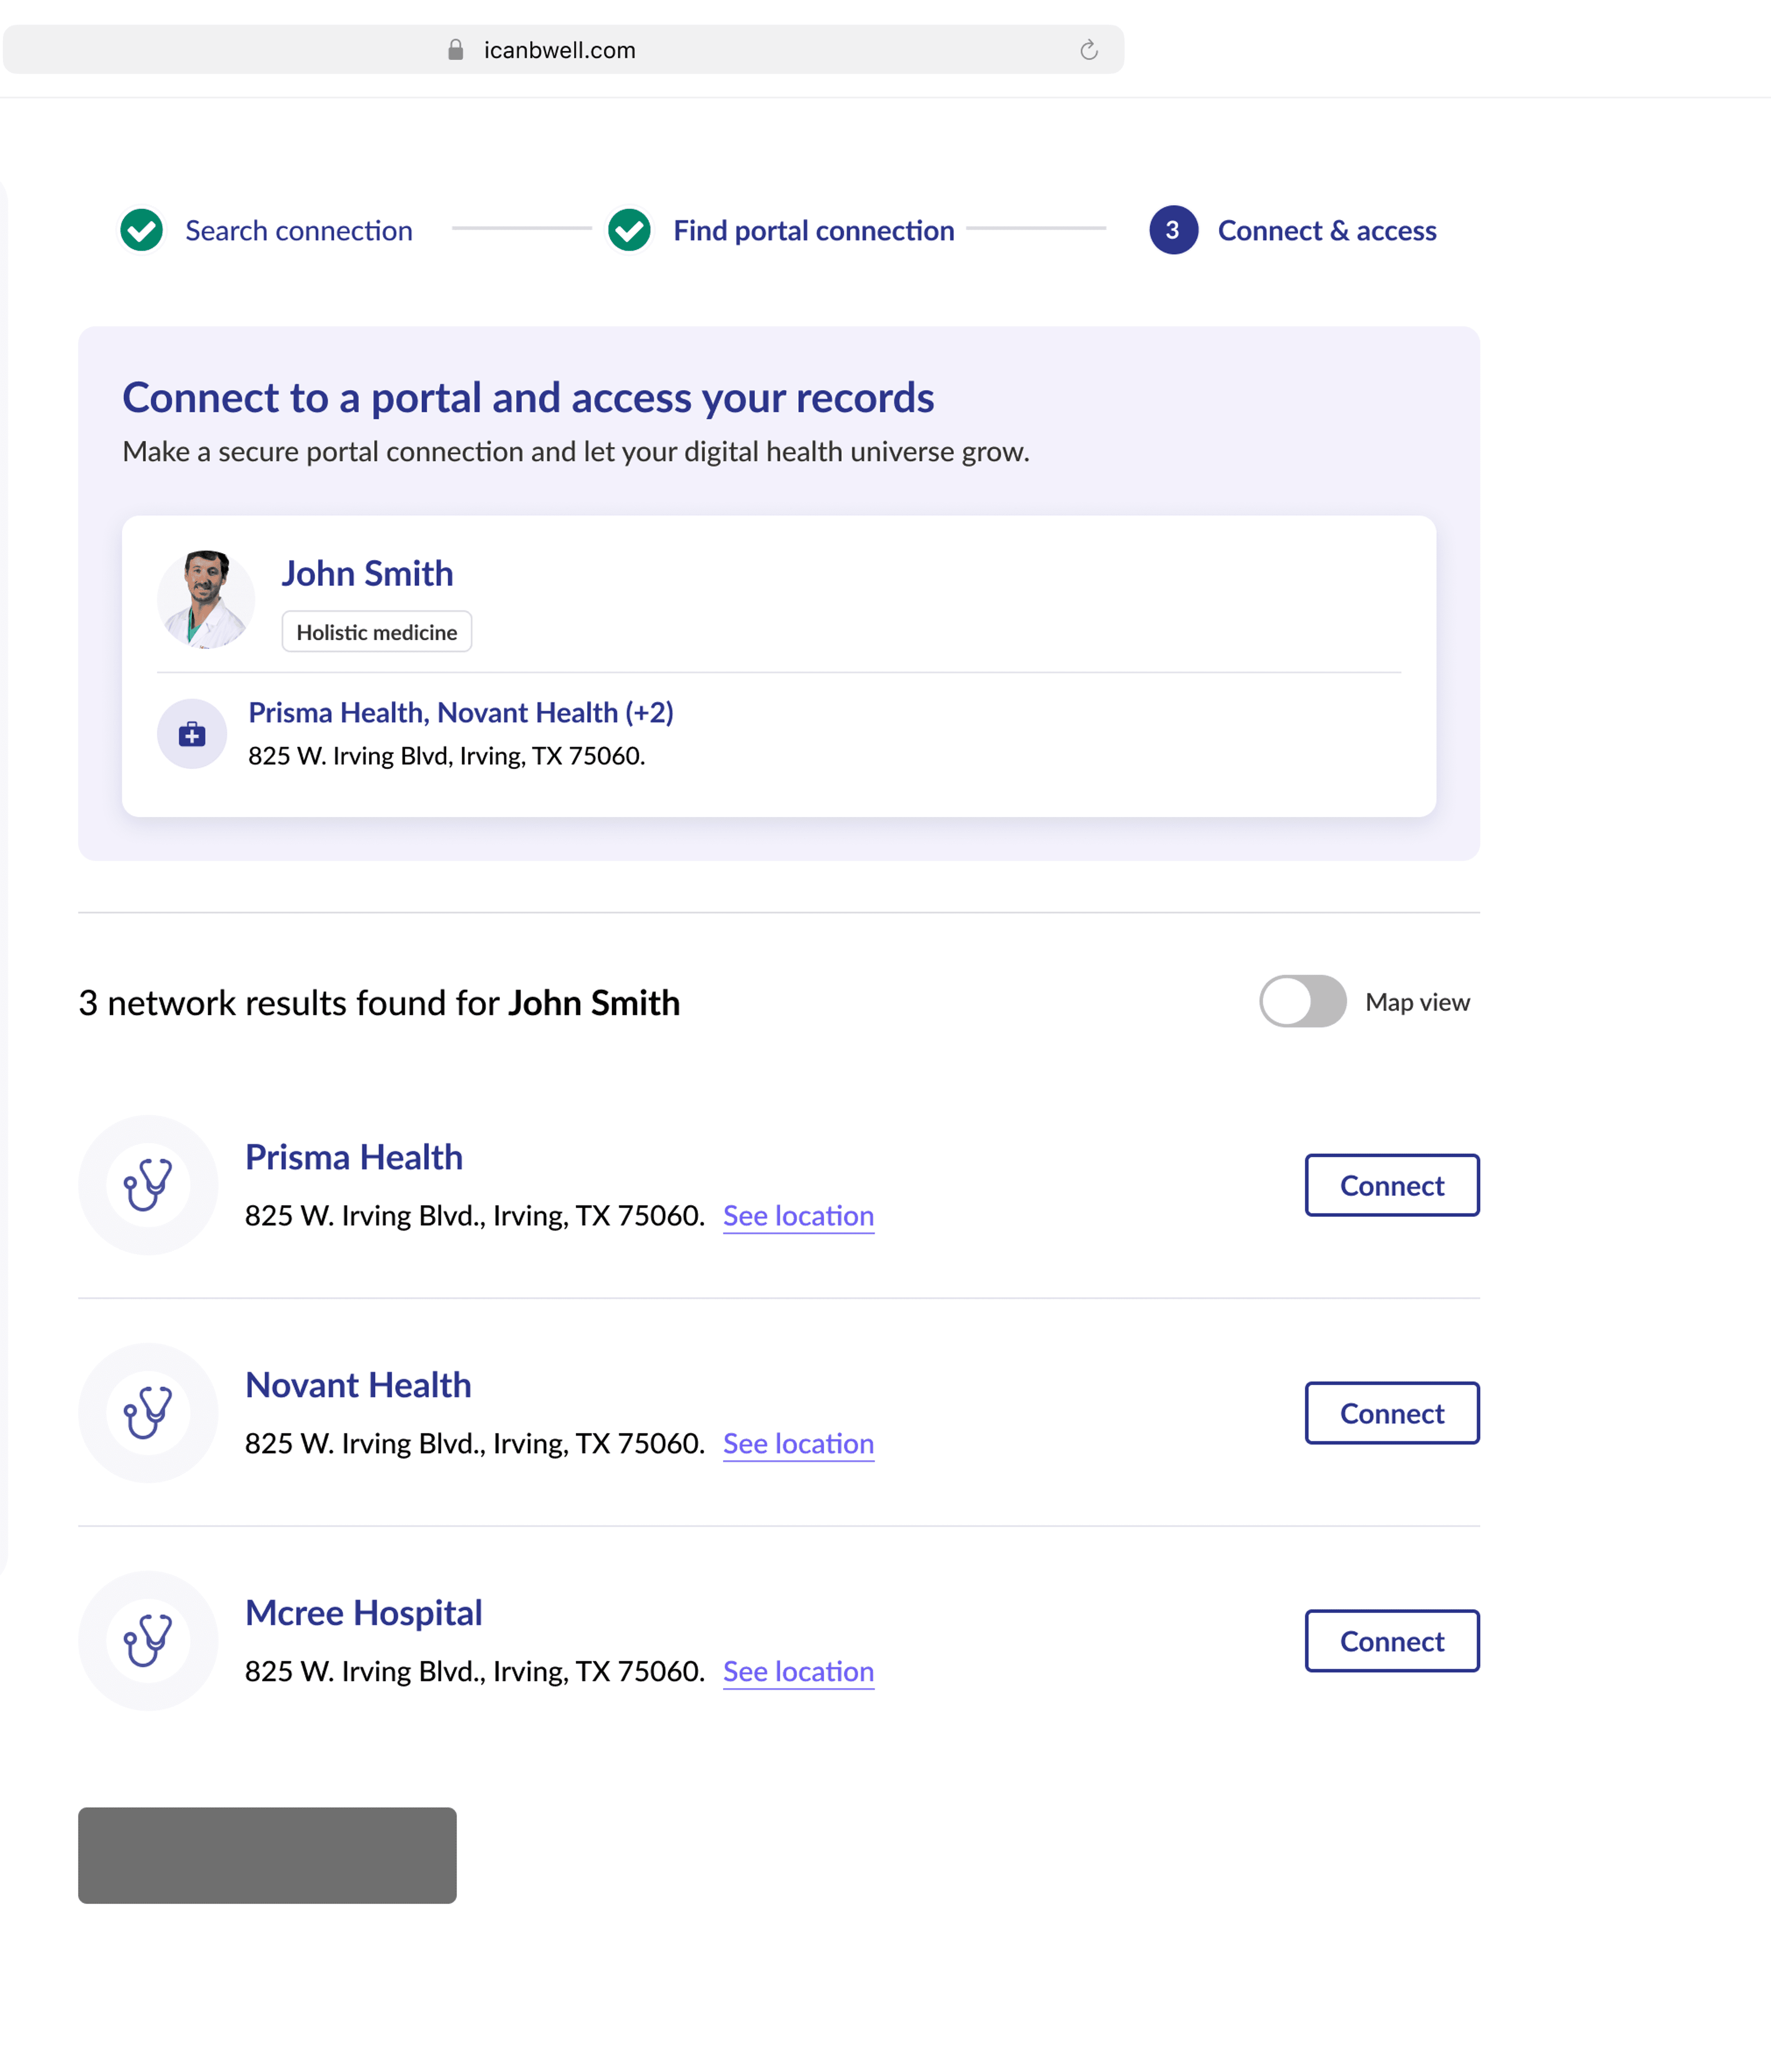
UX Case Study - Enhancing Data Connections
The Data Connections feature was designed to enable users to seamlessly connect to their healthcare providers, insurance companies, labs, and other healthcare facilities to sync all their health records in one place. However, users struggled to understand how to complete the user flow to establish these connections. This was also compounded by an underwhelming user experience that deterred users from focusing long enough to complete the process. Recognizing these challenges, our team embarked on a comprehensive redesign of the entire flow to enhance usability, engagement, retention, and overall user satisfaction.
Feature Redesign Objectives
Improve User Comprehension
Simplify the process of connecting to providers and healthcare facilities to reduce cognitive load.
Enhance User Experience
Revamp the user interface to make the connection flow more engaging and intuitive.
Increase Completion Rate
Motivate users to complete the connection process with more interactive elements.
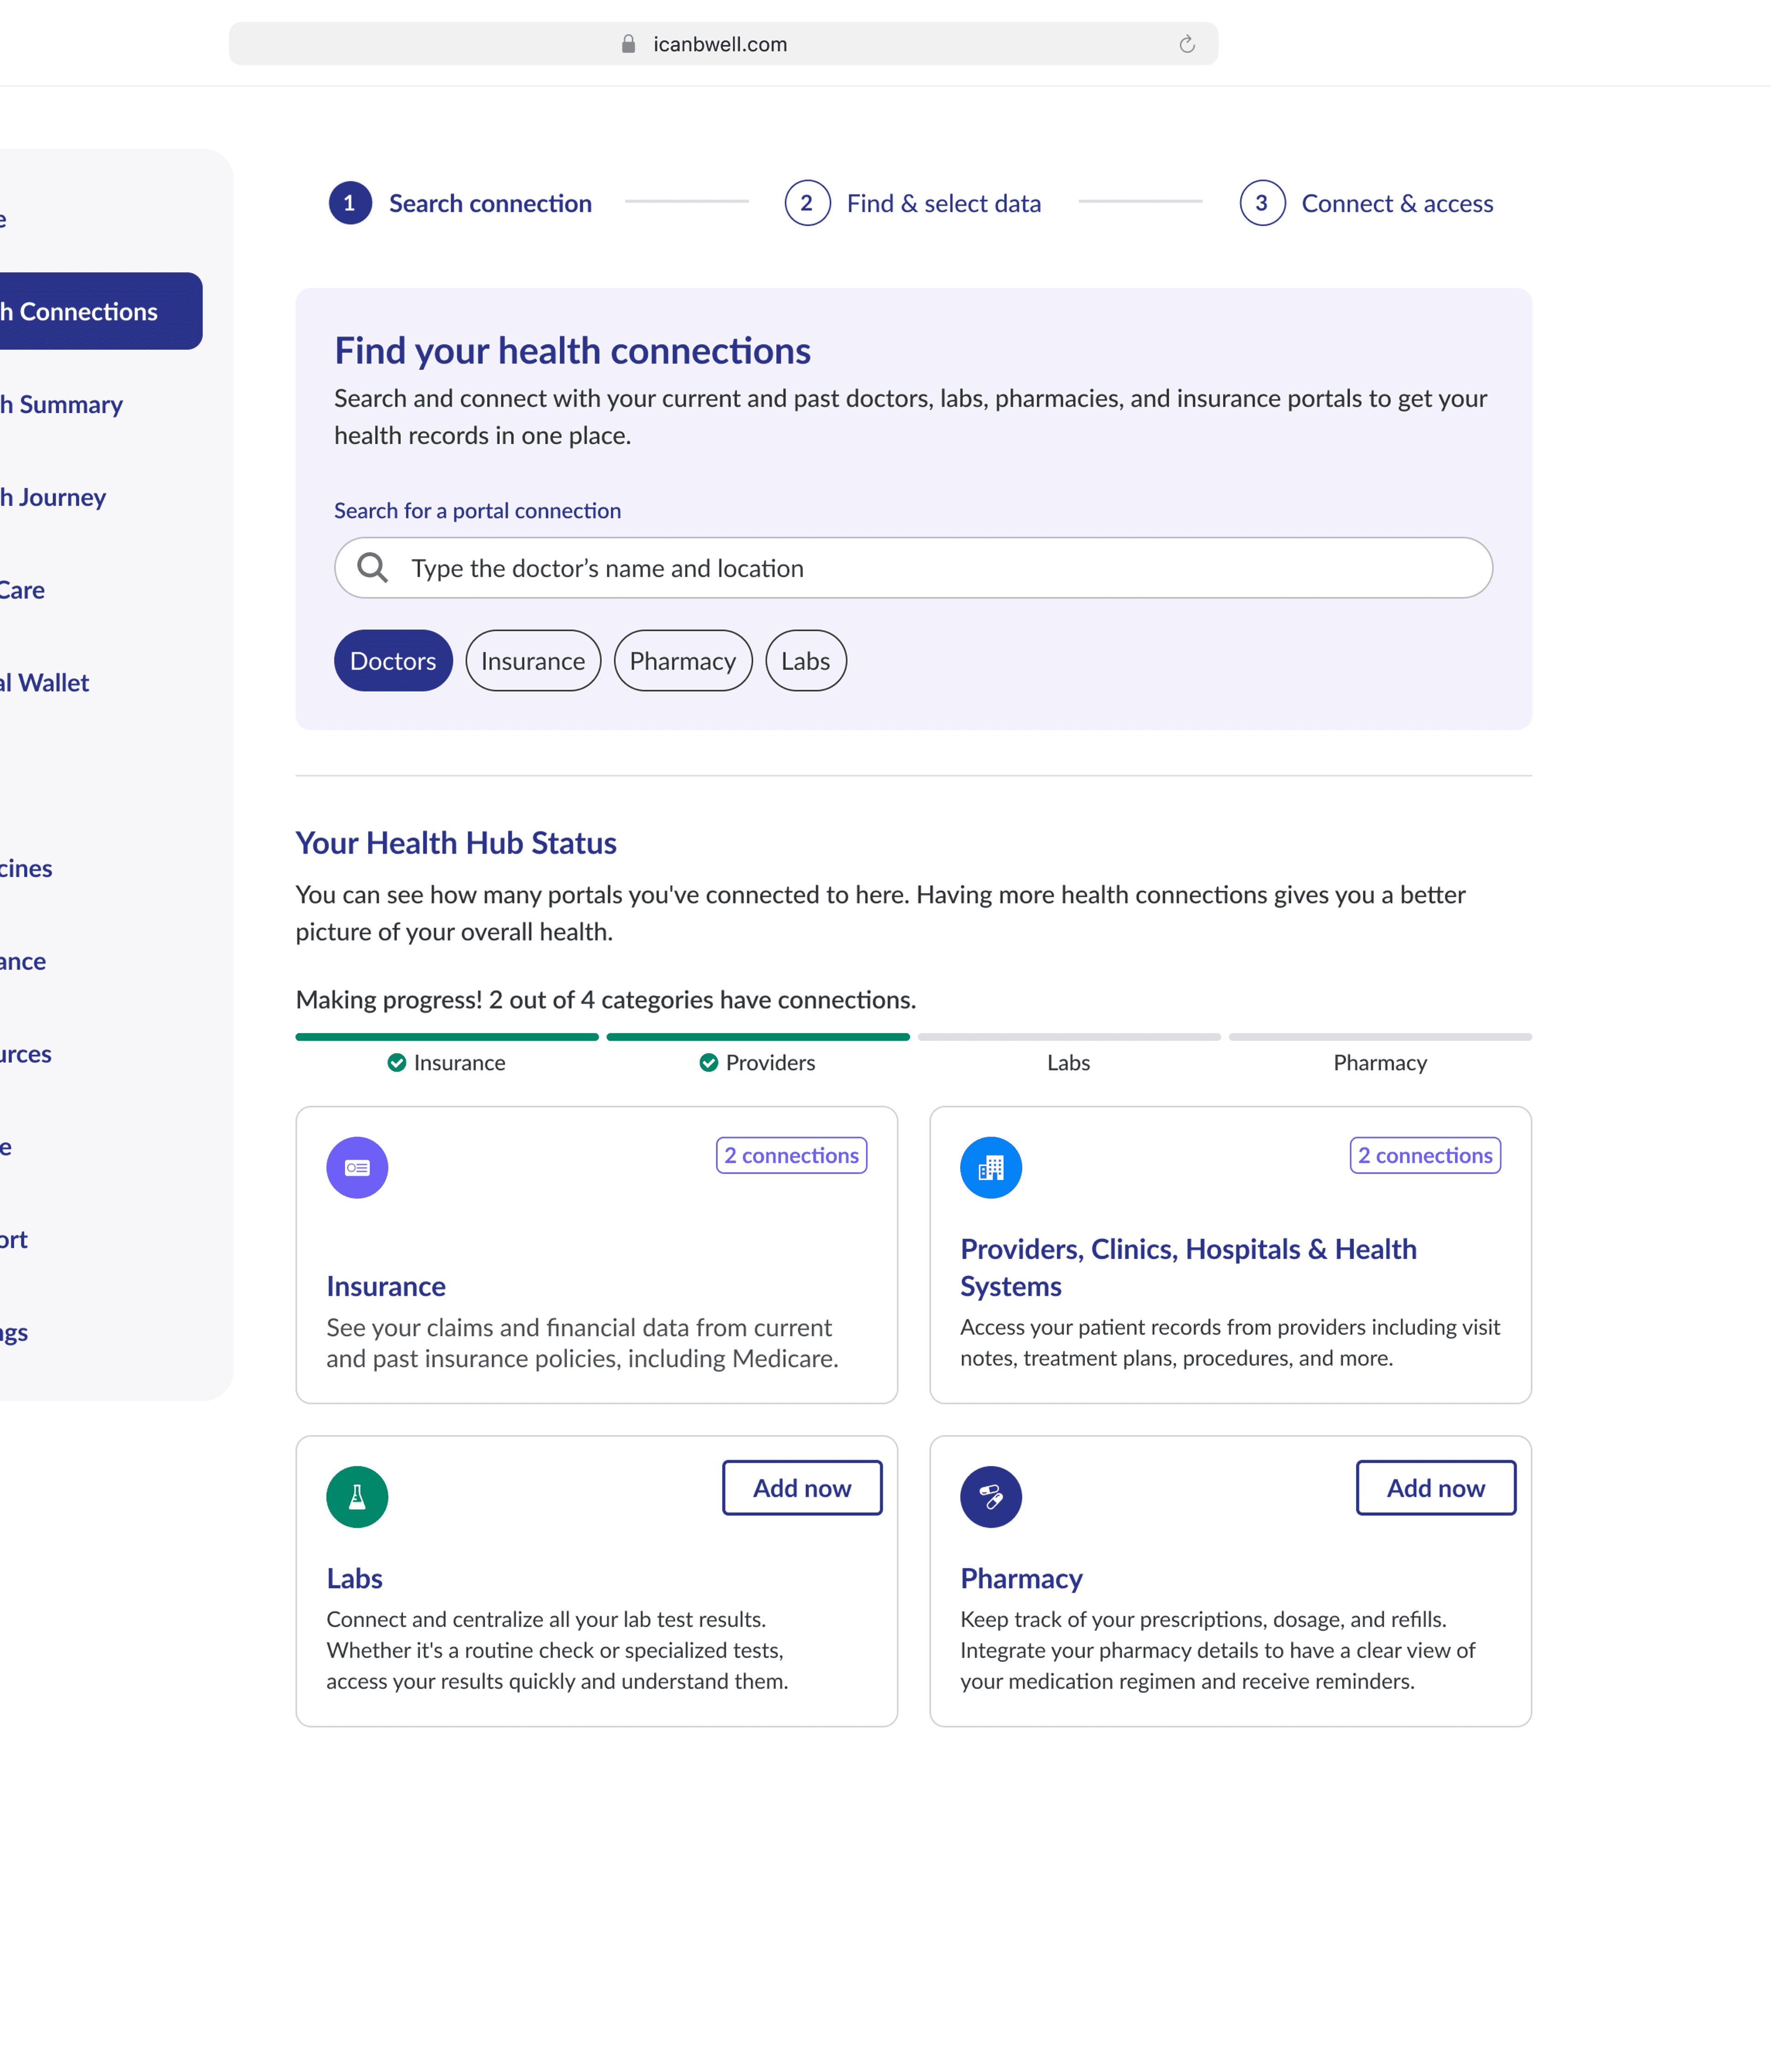
Intuitive Redesign & Simplification
Our main strategy involved overhauling the user interface to make it more interactive and user-friendly. We achieved this with:
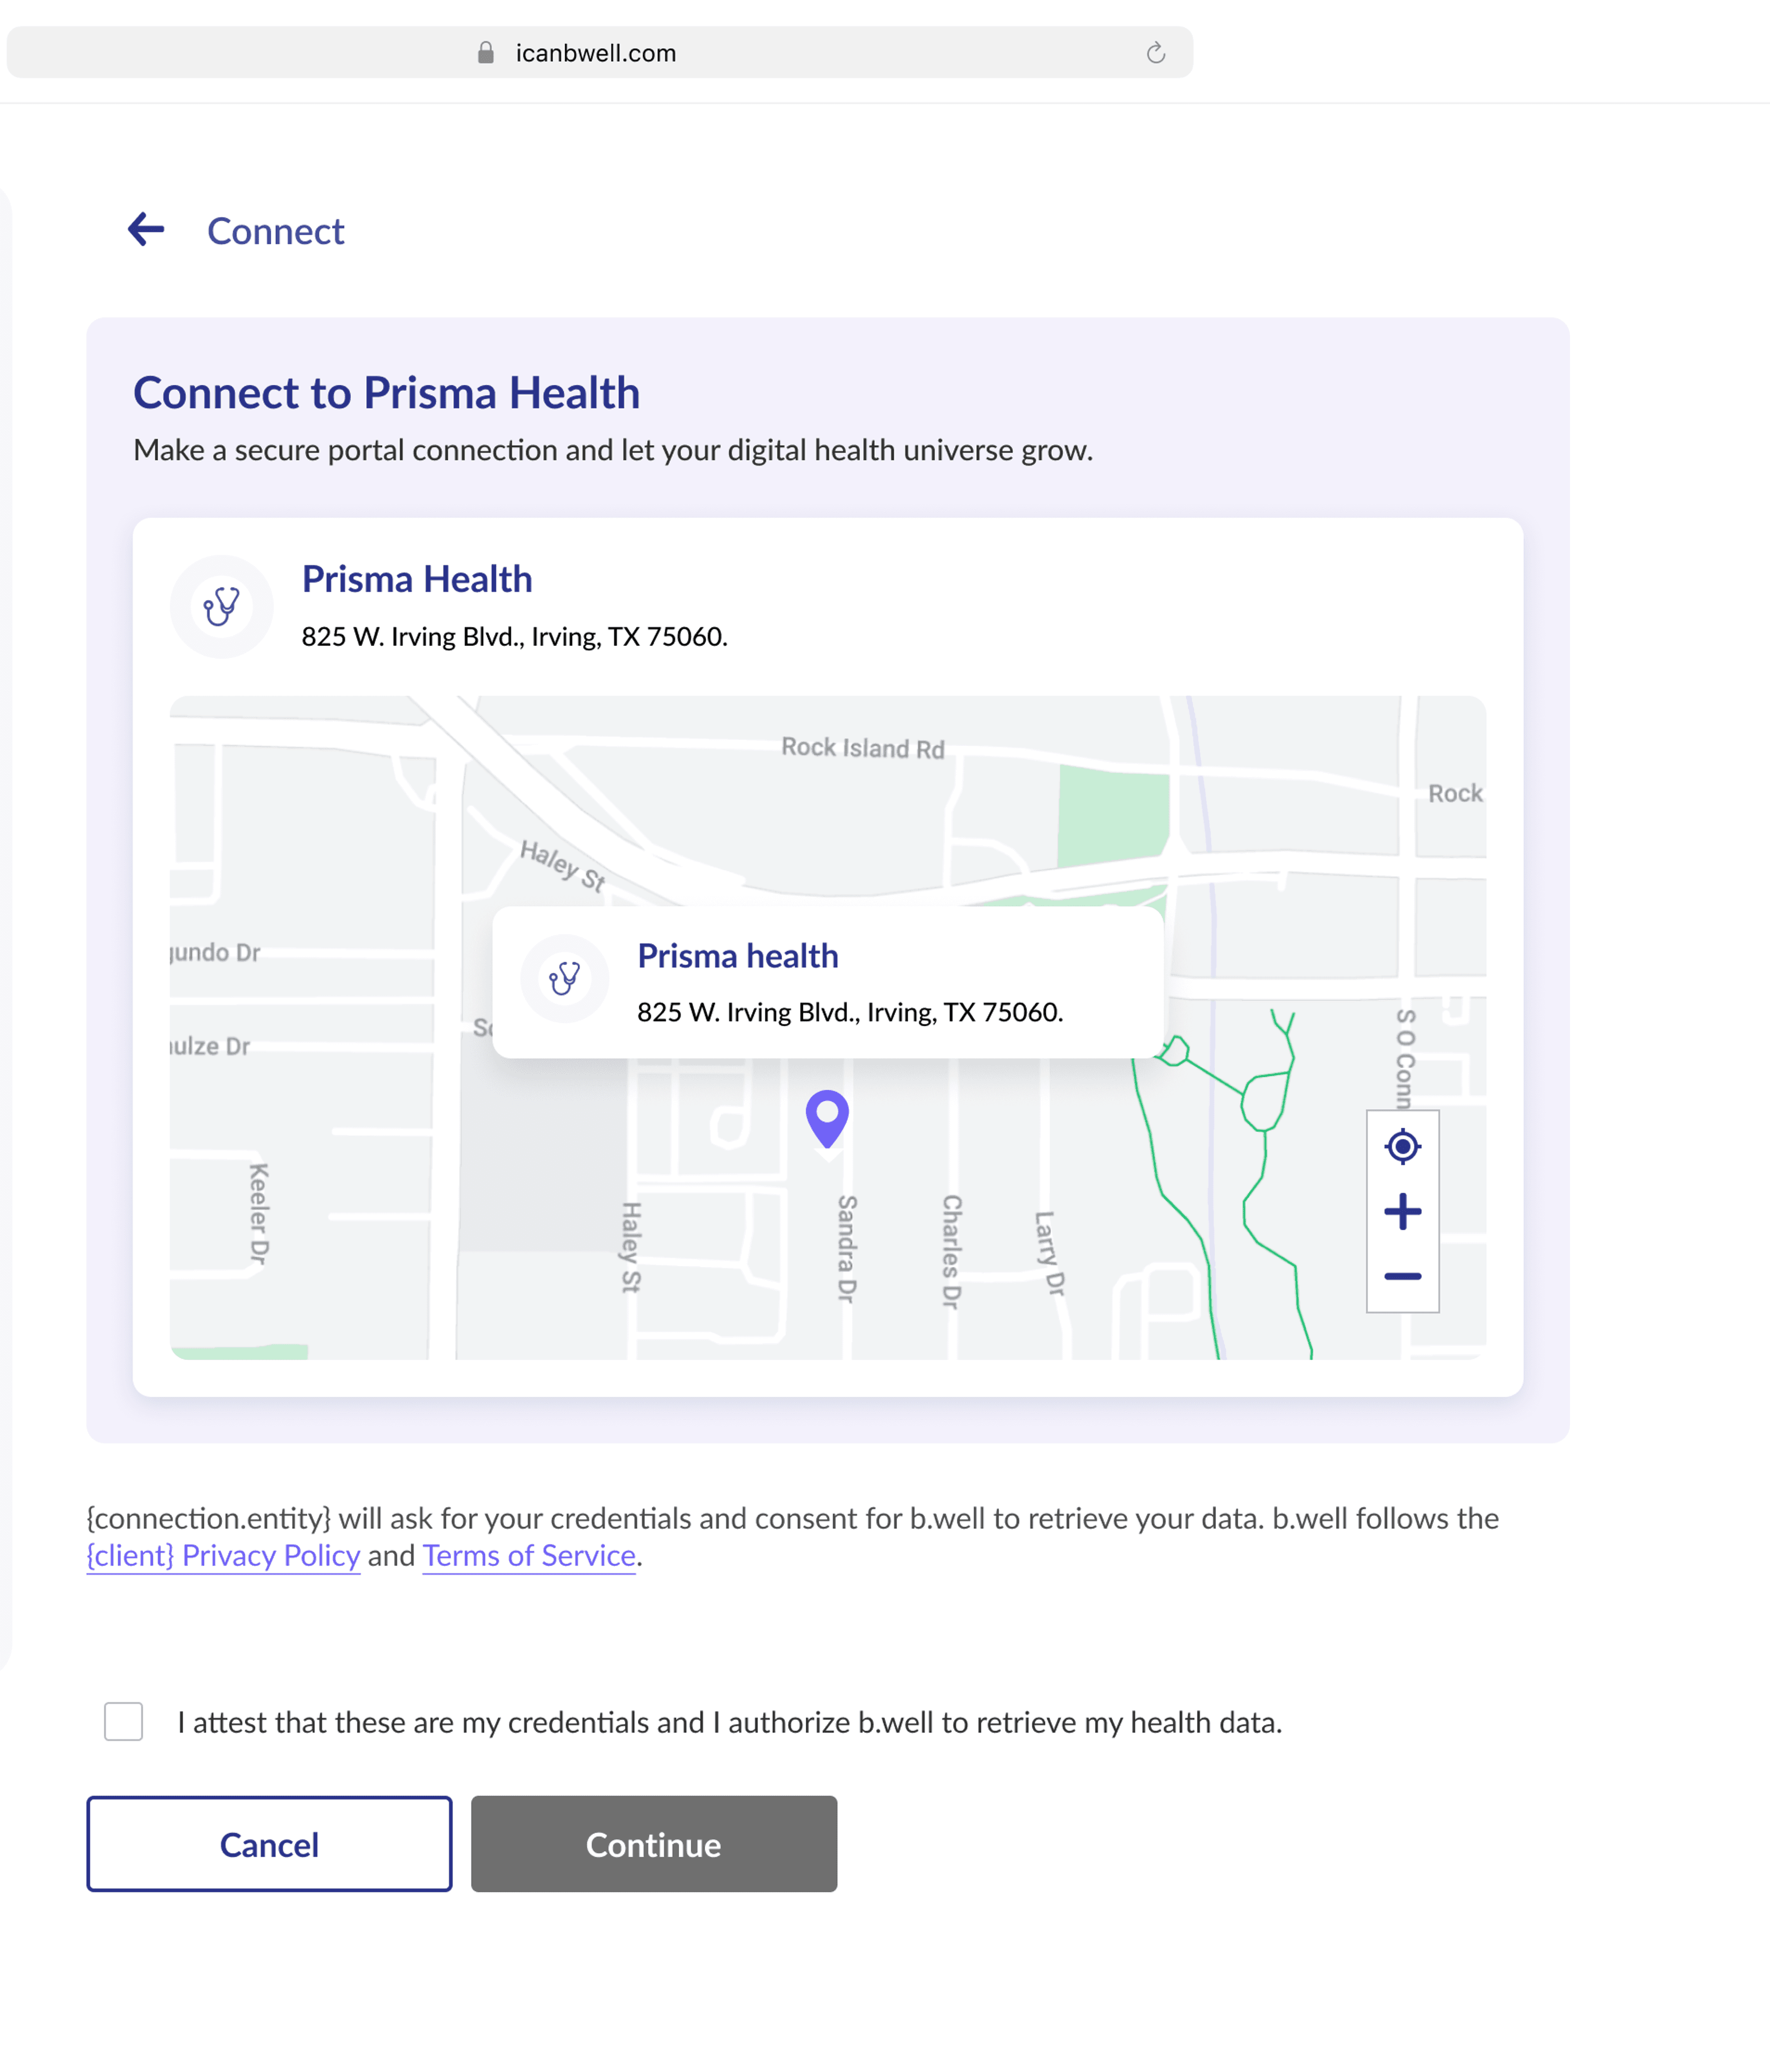
Interactive Design: Introducing dynamic elements to guide users through the connection process in a more engaging manner. This included creating more of a guided experience to create a better dialogue between the user and the UI to reduce cognitive load.
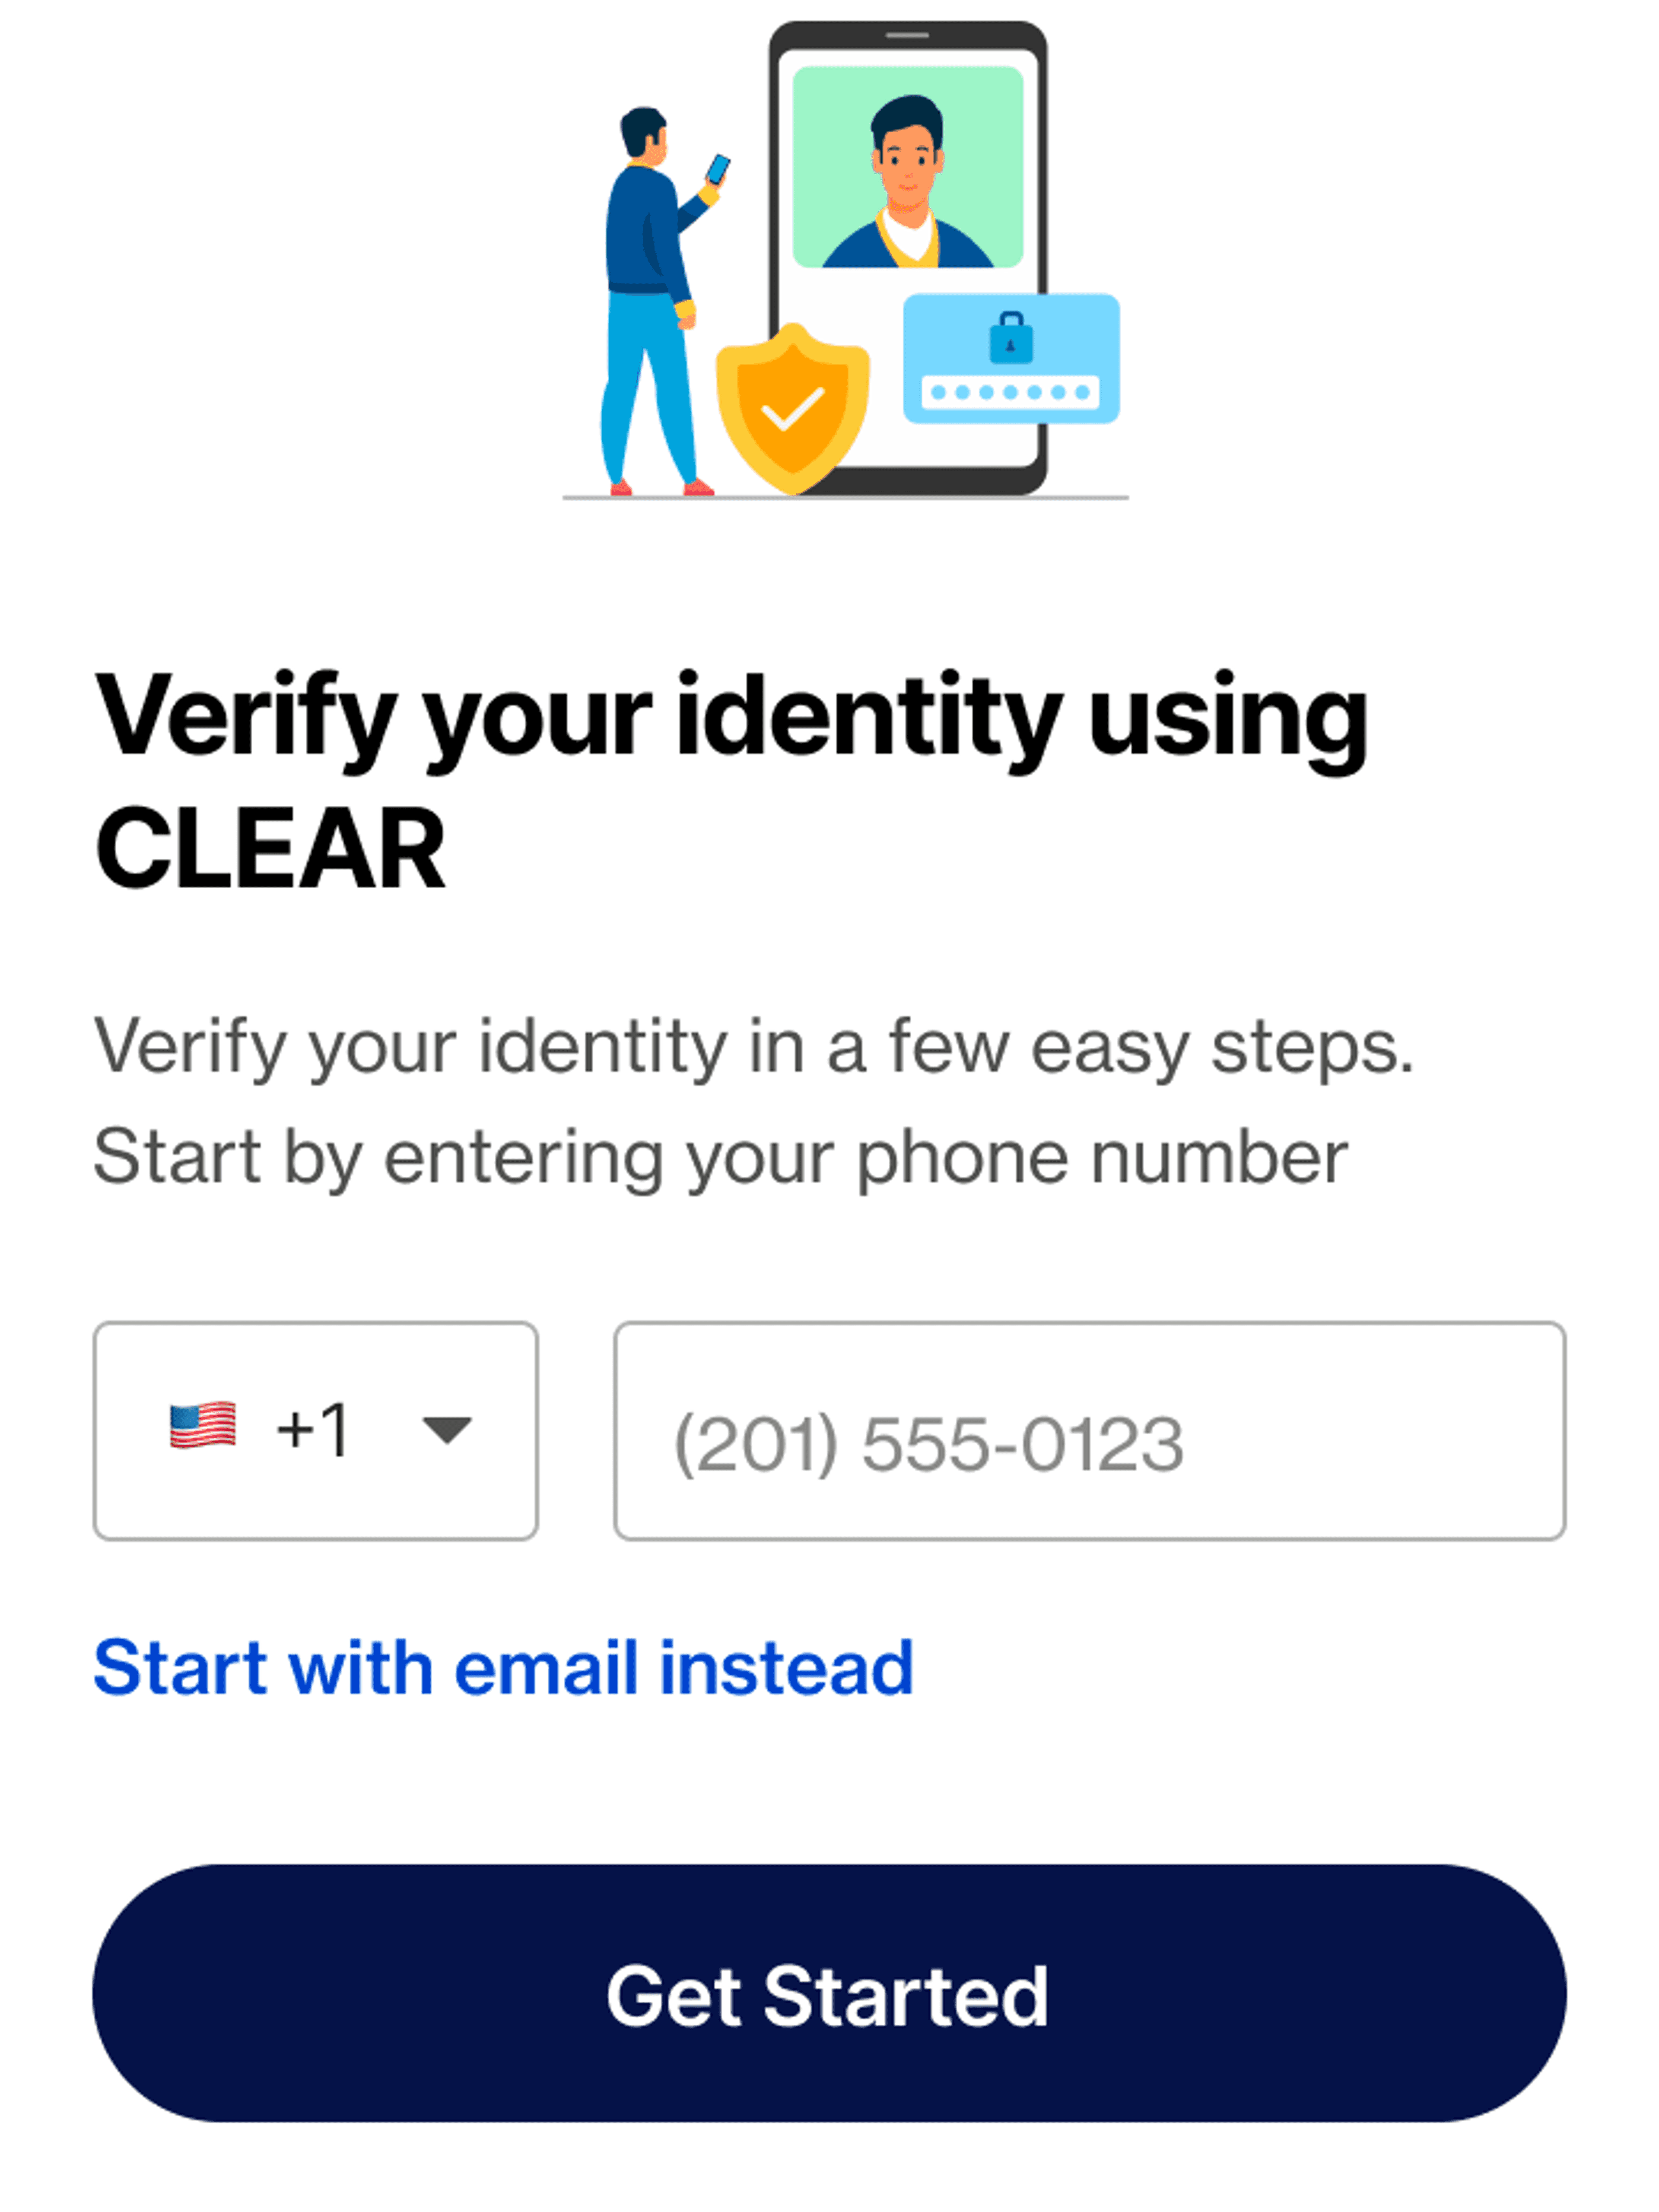
Simplified Content: Rewriting and structuring content to ensure it was digestible and straightforward, enabling users to grasp the necessary steps without feeling overwhelmed. This included simplifying the terminology and introducing tool tips and easy-to-understand snippets of guidance throughout the flow.
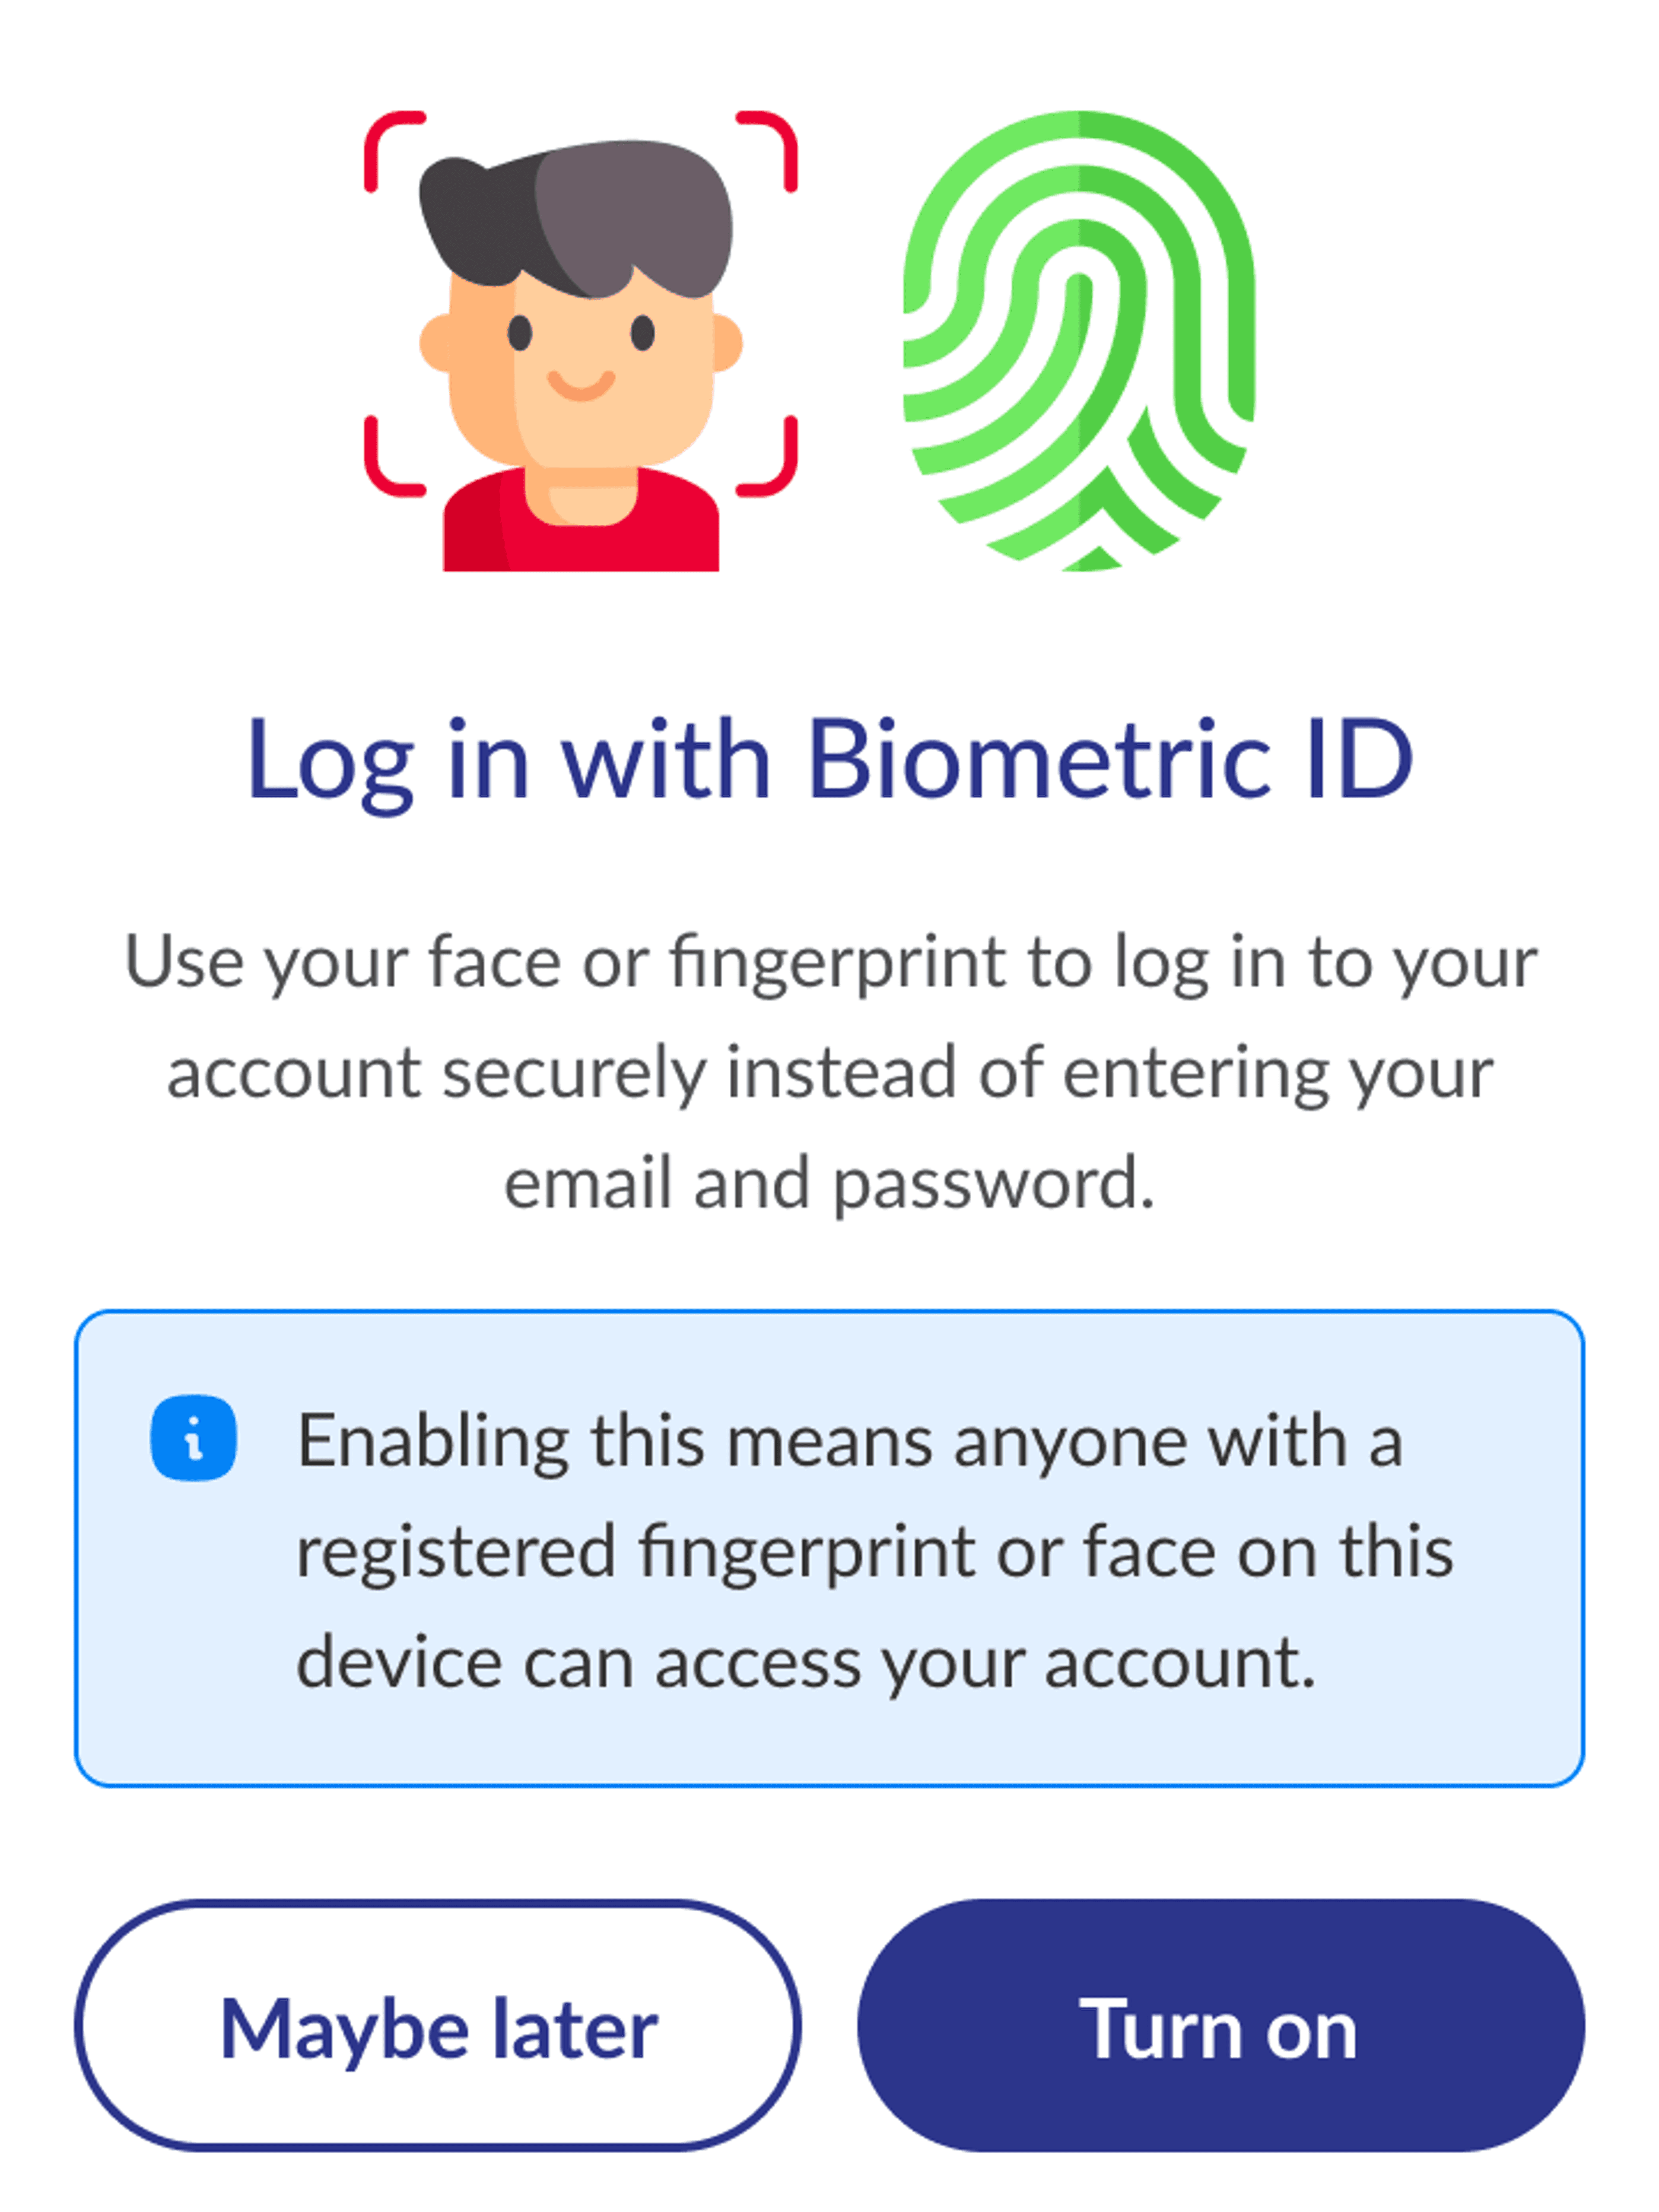
Onboarding Guidance: Implementing feature onboarding that provided clear, step-by-step instructions for the entire flow.
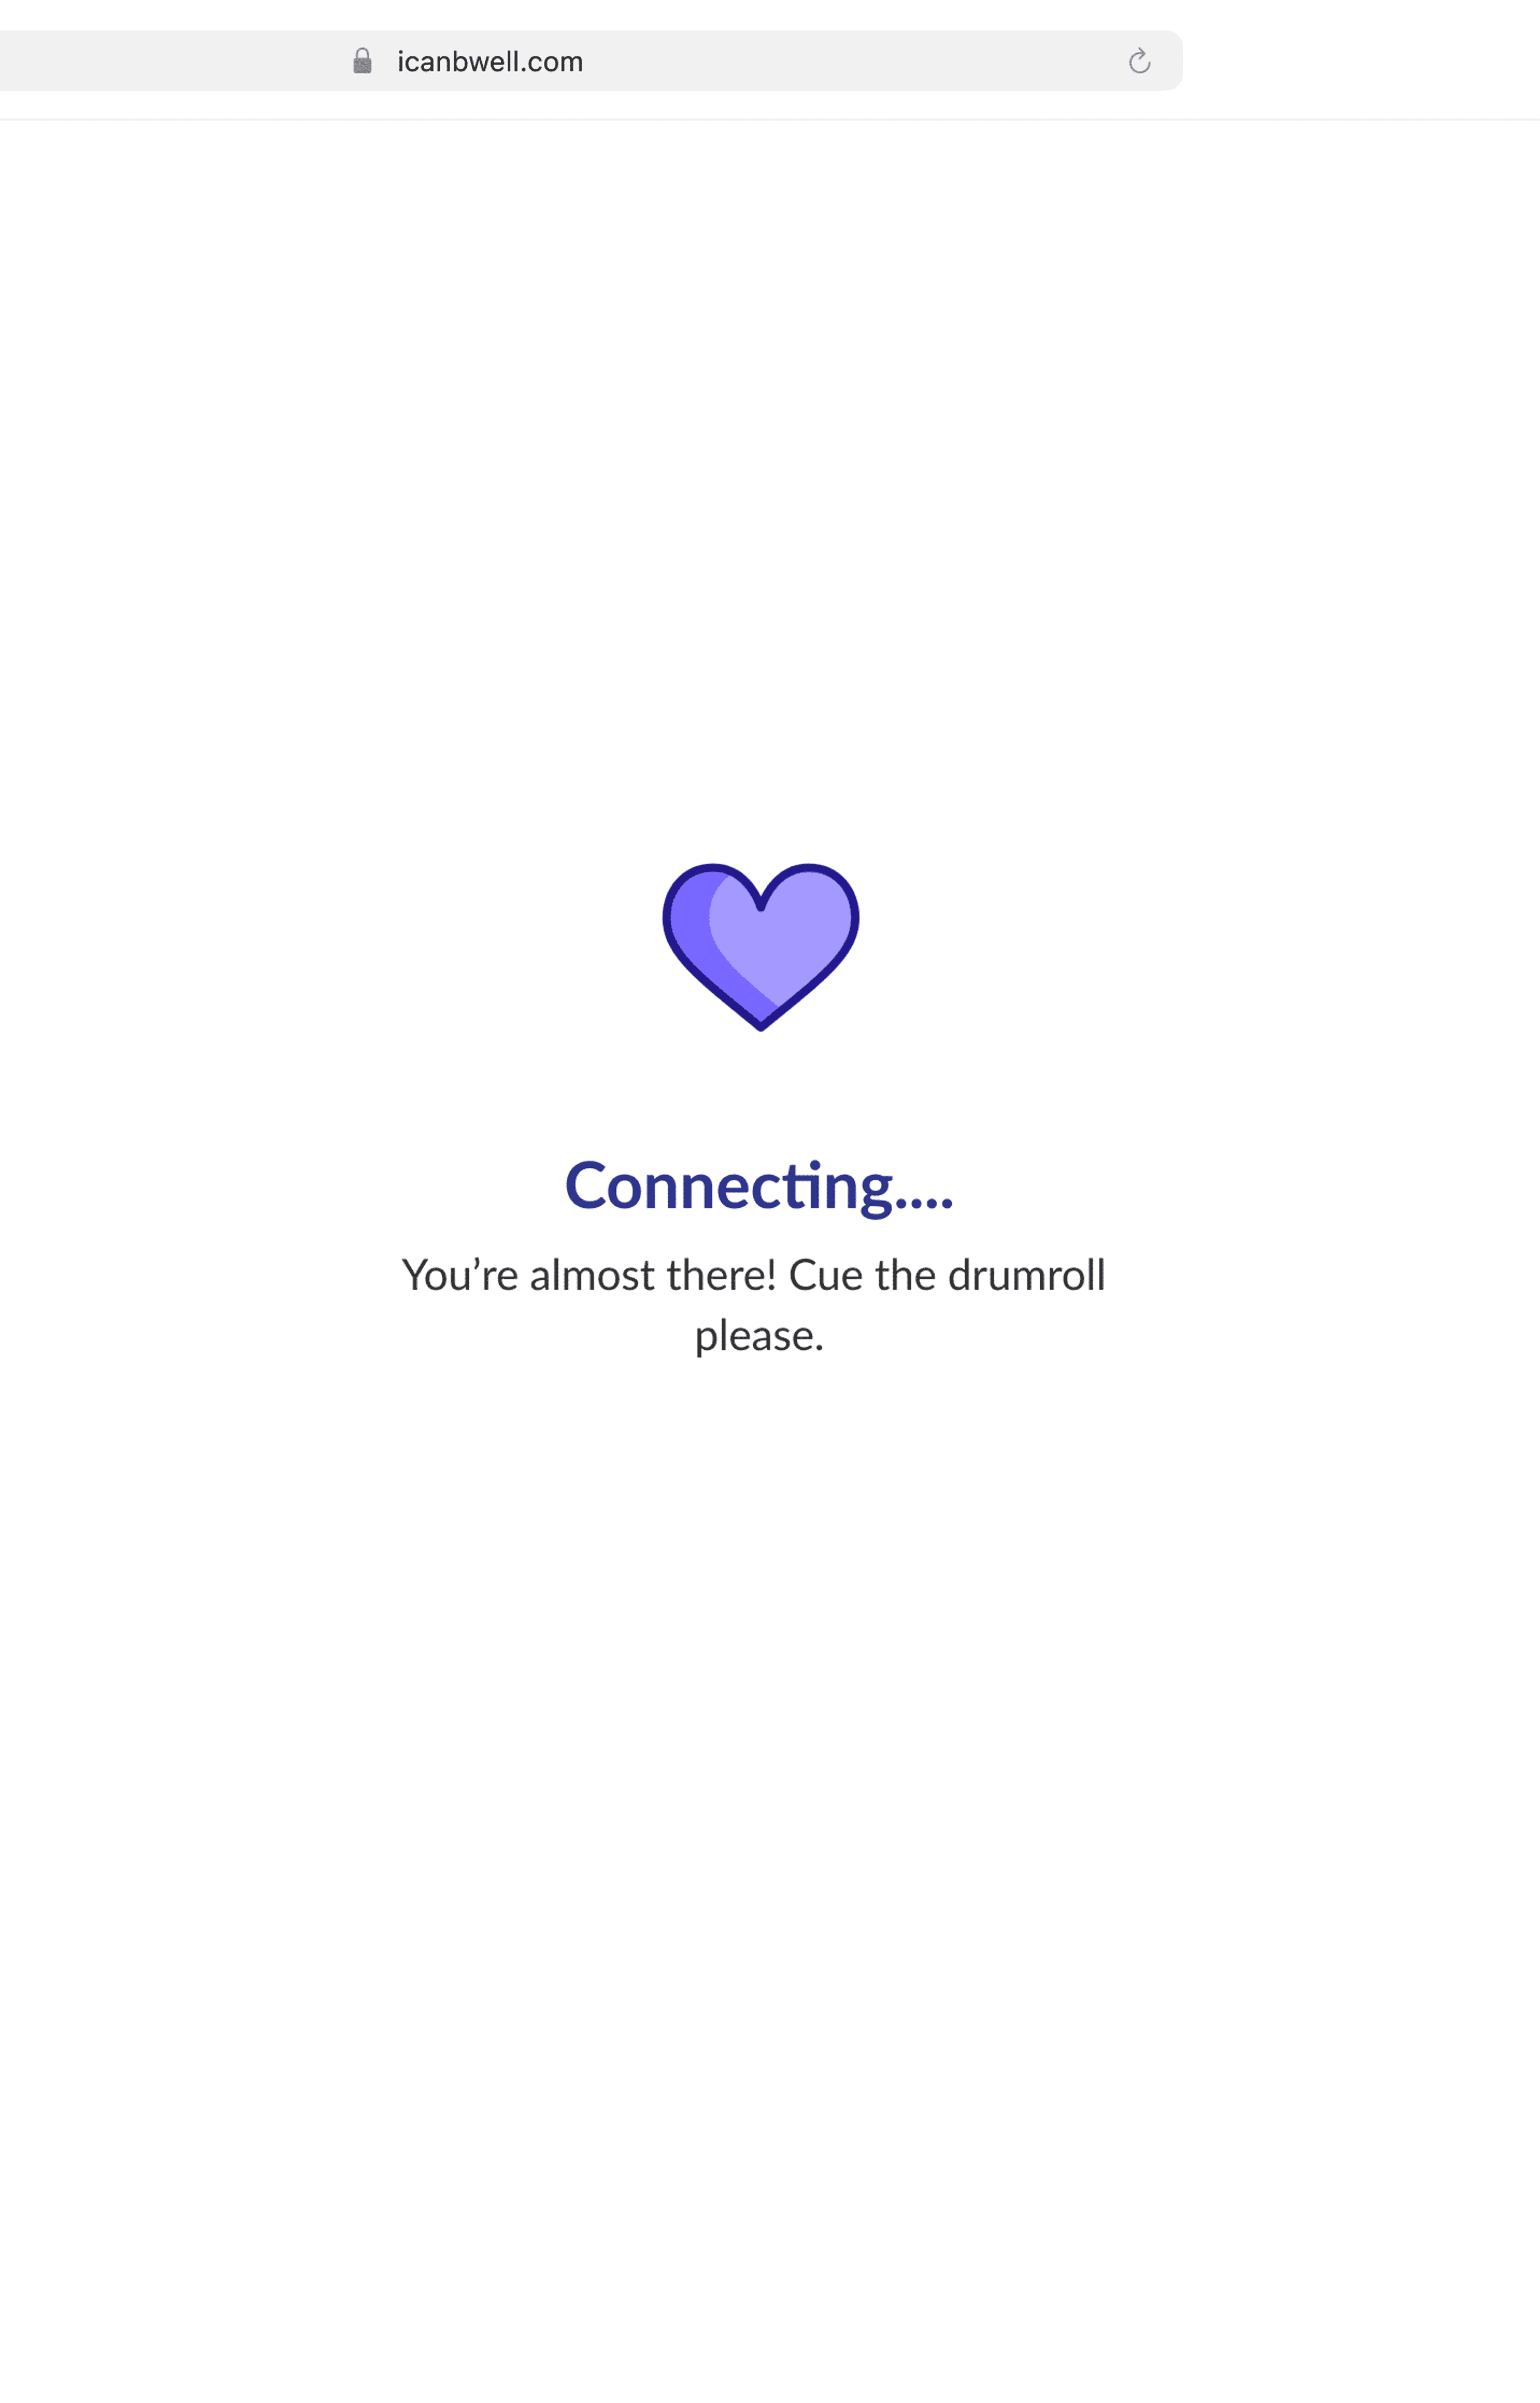
Gamification
To further enhance user engagement and encourage completion of the data connection flow, I suggested adding the following gamification elements to the experience:
Progress Bar: A visual indicator of the user’s progress that fills up as they connect to more of their providers, giving a clear and motivating visualization of their journey toward 100% completion.
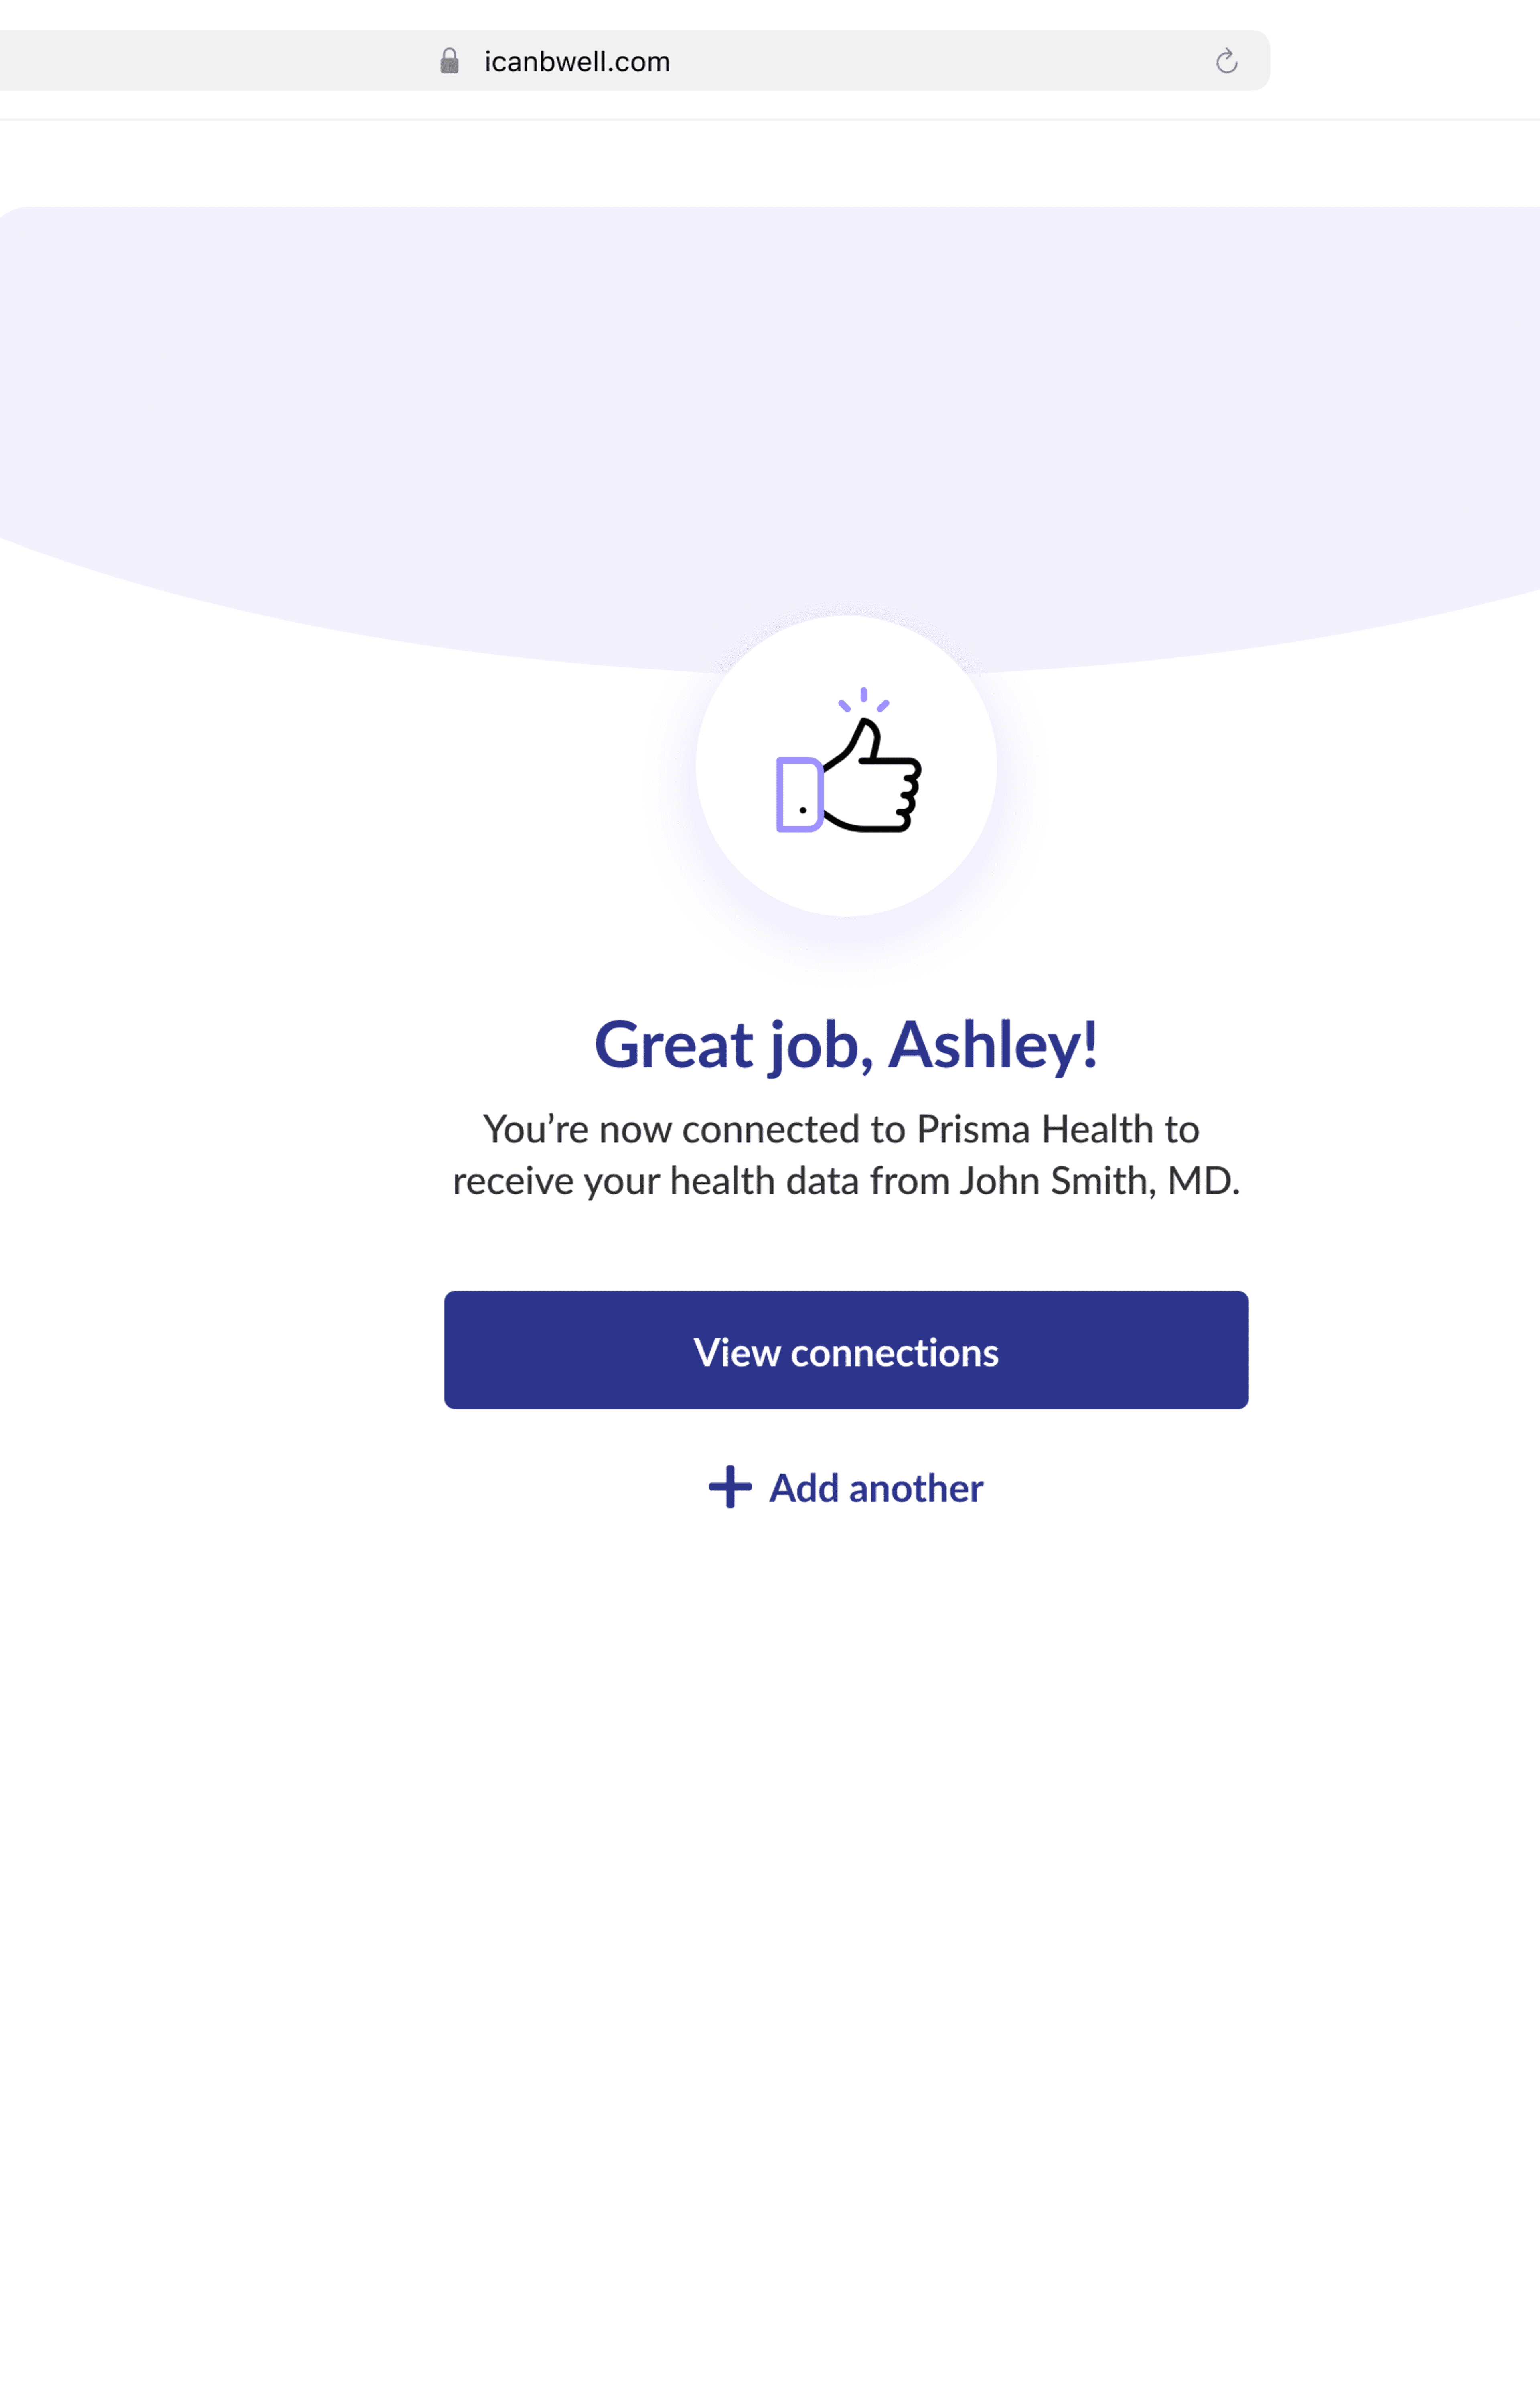
Interactive Elements & Rewards: Incorporating interactive elements like success animations and rewards for achieving milestones, such as successfully connecting to a provider or insurance. This not only made the experience more enjoyable but also incentivized users to complete the process.
Results
Enhanced Engagement
The new, more interactive design and simplified content were praised for transforming the user experience into an enjoyable journey rather than a daunting task.
Improved Comprehension
Tested users reported a significant reduction in cognitive load, stating it was easier for them to understand how to connect to their providers.
Increased Completion Rates
The inclusion of a progress bar and gamification elements helped users feel more compelled to complete the flow, with many expressing satisfaction in seeing their progress visually represented.